前言
之前工作的时候,需要写一个日内交易信号监控软件,预计的功能是实时更新数据,出现信号时有提示功能(比如颜色变化和声音提醒)。如果可能的话最好也有可视化功能。我第一时间就想到了plotly同家出品的Dash,它是一个python Web可视化框架库,之前就有兴趣学,但是因为懒所以一直没有入手。需求来了才开始看文档,边看边翻译、实践,花了几天就写出了一个简单的网站。我个人还是挺满意的,所以也打算出一期教程介绍一下Dash。先把之前翻译的文档放上来把,之后有时间就讲一些高级用法。
下文均翻译自https://dash.plotly.com/,算是一些比较基础的用法,有些地方可能是机翻的,最好还是去官网看。
如果你有html和plotly基础,那入门应该会相当快,没有也没关系,我就不懂html,仿照着官网例子也能写。
安装
pip install dash布局
基本用法
首先,使用以下代码创建一个名为 app.py 的文件。
import dash
import dash_core_components as dcc
import dash_html_components as html
import plotly.express as px
import pandas as pd

external_stylesheets = ['https://codepen.io/chriddyp/pen/bWLwgP.css']

app = dash.Dash(__name__, external_stylesheets=external_stylesheets)

# assume you have a "long-form" data frame
# see https://plotly.com/python/px-arguments/ for more options
df = pd.DataFrame({
    "Fruit": ["Apples", "Oranges", "Bananas", "Apples", "Oranges", "Bananas"],
    "Amount": [4, 1, 2, 2, 4, 5],
    "City": ["SF", "SF", "SF", "Montreal", "Montreal", "Montreal"]
})

fig = px.bar(df, x="Fruit", y="Amount", color="City", barmode="group")

app.layout = html.Div(children=[
    html.H1(children='Hello Dash'),

    html.Div(children='''
        Dash: A web application framework for Python.
    '''),

    dcc.Graph(
        id='example-graph',
        figure=fig
    )
])

if __name__ == '__main__':
    app.run_server(debug=True)
然后运行程序
$ python app.py效果如下:

注意:
- 布局由一个“组件”树组成,比如
html.Div和dcc.Graph。 - 对于每个 HTML 标记,
dash_html_components库都有一个组件。html.H1(children='Hello Dash')
组件在应用程序中生成一个<h1>Hello Dash</h1>HTML 元素。 - 并非所有组件都是纯 HTML。
dash_core_components是可交互式高级组件,通过React.js库用 JavaScript、HTML 和 CSS 生成。 - 每个组件都是通过关键字属性来描述的。dash 是声明式语法:主要通过这些属性描述应用程序。
children属性是特殊的。按照惯例,它总是第一个属性,这意味着您可以忽略它:html.H1(children='Hello Dash')等价于html.H1('Hello Dash')。它还可以包含字符串、数字、单个组件或组件列表。- 应用程序中的字体看起来与此处显示的字体略有不同。此应用程序使用自定义 CSS 样式表来修改元素的默认样式。您可以在 https://dash.plotly.com/external-resources 中了解更多信息,但现在您可以使用
external_stylesheets = ['https://codepen.io/chriddyp/pen/bWLwgP.css']

app = dash.Dash(__name__, external_stylesheets=external_stylesheets)
获得和示例相同的样式。
做出第一项改变
dash 包括 热加载 功能,该功能默认激活,用 app.run_server(debug=True) 启动程序后,当你修改代码时,浏览器会自动刷新你的修改。
试一试:修改标题 Hello Dash
Don't like hot-reloading? You can turn this off with app.run_server(dev_tools_hot_reload=False)更多关于 HTML 的知识
dash_html_components 库对每个 HTML 标记都有对应的组件,同样对于所有 HTML 参数都有对应的关键字参数。
# -*- coding: utf-8 -*-

# Run this app with `python app.py` and
# visit http://127.0.0.1:8050/ in your web browser.

import dash
import dash_core_components as dcc
import dash_html_components as html
import plotly.express as px
import pandas as pd

external_stylesheets = ['https://codepen.io/chriddyp/pen/bWLwgP.css']

app = dash.Dash(__name__, external_stylesheets=external_stylesheets)

colors = {
    'background': '#111111',
    'text': '#7FDBFF'
}

# assume you have a "long-form" data frame
# see https://plotly.com/python/px-arguments/ for more options
df = pd.DataFrame({
    "Fruit": ["Apples", "Oranges", "Bananas", "Apples", "Oranges", "Bananas"],
    "Amount": [4, 1, 2, 2, 4, 5],
    "City": ["SF", "SF", "SF", "Montreal", "Montreal", "Montreal"]
})

fig = px.bar(df, x="Fruit", y="Amount", color="City", barmode="group")

fig.update_layout(
    plot_bgcolor=colors['background'],
    paper_bgcolor=colors['background'],
    font_color=colors['text']
)

app.layout = html.Div(style={'backgroundColor': colors['background']}, children=[
    html.H1(
        children='Hello Dash',
        style={
            'textAlign': 'center',
            'color': colors['text']
        }
    ),

    html.Div(children='Dash: A web application framework for Python.', style={
        'textAlign': 'center',
        'color': colors['text']
    }),

    dcc.Graph(
        id='example-graph-2',
        figure=fig
    )
])

if __name__ == '__main__':
    app.run_server(debug=True)
在这个例子中,我们通过 style 属性修改了 html.Div 和 html.H1 的内联样式。html.H1('Hello Dash', style={'textAlign': 'center', 'color': '#7FDBFF'}) 转换为 HTML 代码即 <h1 style="text-align: center; color: #7FDBFF">Hello Dash</h1>
dash_html_components 和 HTML 属性之间几乎没有重要区别:
- HTML 中的
style属性是以分号分隔的字符串。在 Dash 中,你可以只提供字典。 style字典中的键为驼峰命名,所以使用textAlign代替text-align- HTML
class属性在 dash 中为·className·。 - HTML 标记的子级是通过 children 关键字参数指定的。按照惯例,这总是第一个参数,所以它经常被省略。
除此之外,所有可用的 HTML 属性和标记都可以在 Python context 中使用。
可复用组件
通过用 Python 编写我们的标记,我们可以创建复杂的可重用组件,如表,而无需切换上下文或语言。
# Run this app with `python app.py` and
# visit http://127.0.0.1:8050/ in your web browser.

import dash
import dash_core_components as dcc
import dash_html_components as html
import pandas as pd

df = pd.read_csv('https://gist.githubusercontent.com/chriddyp/c78bf172206ce24f77d6363a2d754b59/raw/c353e8ef842413cae56ae3920b8fd78468aa4cb2/usa-agricultural-exports-2011.csv')


def generate_table(dataframe, max_rows=10):
    return html.Table([
        html.Thead(
            html.Tr([html.Th(col) for col in dataframe.columns])
        ),
        html.Tbody([
            html.Tr([
                html.Td(dataframe.iloc[i][col]) for col in dataframe.columns
            ]) for i in range(min(len(dataframe), max_rows))
        ])
    ])


external_stylesheets = ['https://codepen.io/chriddyp/pen/bWLwgP.css']

app = dash.Dash(__name__, external_stylesheets=external_stylesheets)

app.layout = html.Div(children=[
    html.H4(children='US Agriculture Exports (2011)'),
    generate_table(df)
])

if __name__ == '__main__':
    app.run_server(debug=True)
更多关于可视化的知识
dash_core_components 库包括一个名为 Graph 的组件
Graph 使用开源的 plotly.js JavaScript 图形库渲染可交互式数据。plotly.js 支持超过 35 种图表类型,并以矢量质量 SVG 和高性能 WebGL 呈现图表。
dash_core_components.Graph 中的 figure 参数和 plotly.py 中的 figure 参数相同。
# Run this app with `python app.py` and
# visit http://127.0.0.1:8050/ in your web browser.

import dash
import dash_core_components as dcc
import dash_html_components as html
import plotly.express as px
import pandas as pd


external_stylesheets = ['https://codepen.io/chriddyp/pen/bWLwgP.css']

app = dash.Dash(__name__, external_stylesheets=external_stylesheets)

df = pd.read_csv('https://gist.githubusercontent.com/chriddyp/5d1ea79569ed194d432e56108a04d188/raw/a9f9e8076b837d541398e999dcbac2b2826a81f8/gdp-life-exp-2007.csv')

fig = px.scatter(df, x="gdp per capita", y="life expectancy",
                 size="population", color="continent", hover_name="country",
                 log_x=True, size_max=60)

app.layout = html.Div([
    dcc.Graph(
        id='life-exp-vs-gdp',
        figure=fig
    )
])

if __name__ == '__main__':
    app.run_server(debug=True)
效果:

Markdown
我们也可以直接使用 Markdown 语法来实现部分 HTML 代码
# Run this app with `python app.py` and
# visit http://127.0.0.1:8050/ in your web browser.

import dash
import dash_core_components as dcc
import dash_html_components as html

external_stylesheets = ['https://codepen.io/chriddyp/pen/bWLwgP.css']

app = dash.Dash(__name__, external_stylesheets=external_stylesheets)

markdown_text = '''
### Dash and Markdown

Dash apps can be written in Markdown.
Dash uses the [CommonMark](http://commonmark.org/)
specification of Markdown.
Check out their [60 Second Markdown Tutorial](http://commonmark.org/help/)
if this is your first introduction to Markdown!
'''

app.layout = html.Div([
    dcc.Markdown(children=markdown_text)
])

if __name__ == '__main__':
    app.run_server(debug=True)
Core Components
dash_core_components 包括了大量的高级组件,如下拉菜单、复选框等等,详见 https://dash.plotly.com/dash-core-components
# -*- coding: utf-8 -*-

# Run this app with `python app.py` and
# visit http://127.0.0.1:8050/ in your web browser.

import dash
import dash_core_components as dcc
import dash_html_components as html

external_stylesheets = ['https://codepen.io/chriddyp/pen/bWLwgP.css']

app = dash.Dash(__name__, external_stylesheets=external_stylesheets)

app.layout = html.Div([
    html.Label('Dropdown'),
    dcc.Dropdown(
        options=[
            {'label': 'New York City', 'value': 'NYC'},
            {'label': u'Montréal', 'value': 'MTL'},
            {'label': 'San Francisco', 'value': 'SF'}
        ],
        value='MTL'
    ),

    html.Label('Multi-Select Dropdown'),
    dcc.Dropdown(
        options=[
            {'label': 'New York City', 'value': 'NYC'},
            {'label': u'Montréal', 'value': 'MTL'},
            {'label': 'San Francisco', 'value': 'SF'}
        ],
        value=['MTL', 'SF'],
        multi=True
    ),

    html.Label('Radio Items'),
    dcc.RadioItems(
        options=[
            {'label': 'New York City', 'value': 'NYC'},
            {'label': u'Montréal', 'value': 'MTL'},
            {'label': 'San Francisco', 'value': 'SF'}
        ],
        value='MTL'
    ),

    html.Label('Checkboxes'),
    dcc.Checklist(
        options=[
            {'label': 'New York City', 'value': 'NYC'},
            {'label': u'Montréal', 'value': 'MTL'},
            {'label': 'San Francisco', 'value': 'SF'}
        ],
        value=['MTL', 'SF']
    ),

    html.Label('Text Input'),
    dcc.Input(value='MTL', type='text'),

    html.Label('Slider'),
    dcc.Slider(
        min=0,
        max=9,
        marks={i: 'Label {}'.format(i) if i == 1 else str(i) for i in range(1, 6)},
        value=5,
    ),
], style={'columnCount': 2})

if __name__ == '__main__':
    app.run_server(debug=True)
value 是默认值
Dash 回调
本章介绍如何使用回调函数来制作 Dash 应用程序:当输入组件的属性更改时,Dash 自动调用 python 函数。
简单的交互式 Dash 应用
import dash
import dash_core_components as dcc
import dash_html_components as html
from dash.dependencies import Input, Output

external_stylesheets = ['https://codepen.io/chriddyp/pen/bWLwgP.css']

app = dash.Dash(__name__, external_stylesheets=external_stylesheets)

app.layout = html.Div([
    html.H6("Change the value in the text box to see callbacks in action!"),
    html.Div(["Input: ",
              dcc.Input(id='my-input', value='initial value', type='text')]),
    html.Br(),
    html.Div(id='my-output'),

])


@app.callback(
    Output(component_id='my-output', component_property='children'),
    [Input(component_id='my-input', component_property='value')]
)
def update_output_div(input_value):
    return 'Output: {}'.format(input_value)


if __name__ == '__main__':
    app.run_server(debug=True)
让我们拆解这个例子:
应用程序接口的“输入”和“输出”被声明为装饰器
@app.callback的参数- 通过编写这个 decorator,我们告诉 Dash 只要“输入组件”(文本框)的值发生变化,就调用该函数,以更新页面上“输出”组件(HTML div)的子组件
- 装饰器下的函数名可以任意
- 装饰器中的 id 必须与 dash 中 layout 的 id 相同
- 在 Dash 中,我们应用程序的输入和输出只是一个特定组件的属性。在这个例子中,我们的输入是 ID 为 "my-input "的组件的 "value "属性。我们的输出是 ID 为 "my-output "的组件的 "children "属性。
- 每当一个输入属性发生变化时,回调装饰器封装的函数就会自动被调用。Dash 向函数提供输入属性的新值作为输入参数,Dash 则使用函数返回的任何内容更新输出组件的属性。
component_id和component_property关键字是可选的(每个对象只有两个参数)。为了清楚起见,在这个例子中包含了这两个关键字,但为了简洁和可读性,在文档的其余部分将省略这两个关键字。- 不要混淆
dash.dependencies.Input对象和dash_core_components.Input对象。前者只是在这些回调中使用,后者是一个实际的组件。 - 请注意,我们没有在布局中为 my-output 组件的 children 属性设置一个值。当 Dash 应用程序启动时,它会自动调用所有具有输入组件初始值的回调,以便填充输出组件的初始状态。在此示例中,如果您指定了类似
html.Div(id='my-output', children='Hello world')这样的内容,当应用程序启动时,它将被覆盖。
Dash App Layout With Figure and Slider
让我们看看另一个例子,在这个例子中,dcc.Slider 更新了一个 dcc.Graph。
import dash
import dash_core_components as dcc
import dash_html_components as html
from dash.dependencies import Input, Output
import plotly.express as px

import pandas as pd

df = pd.read_csv('https://cdn.jsdelivr.net/gh/plotly/datasets/gapminderDataFiveYear.csv')

external_stylesheets = ['https://codepen.io/chriddyp/pen/bWLwgP.css']

app = dash.Dash(__name__, external_stylesheets=external_stylesheets)

app.layout = html.Div([
    dcc.Graph(id='graph-with-slider'),
    dcc.Slider(
        id='year-slider',
        min=df['year'].min(),
        max=df['year'].max(),
        value=df['year'].min(),
        marks={str(year): str(year) for year in df['year'].unique()},
        step=None
    )
])


@app.callback(
    Output('graph-with-slider', 'figure'),
    [Input('year-slider', 'value')])
def update_figure(selected_year):
    filtered_df = df[df.year == selected_year]

    fig = px.scatter(filtered_df, x="gdpPercap", y="lifeExp",
                     size="pop", color="continent", hover_name="country",
                     log_x=True, size_max=55)

    fig.update_layout(transition_duration=500)

    return fig


if __name__ == '__main__':
    app.run_server(debug=True)
效果图:

在这个例子中,Slider 的 "value "属性是应用程序的输入,应用程序的输出是 Graph 的 "figure "属性。每当 Slider 的值发生变化时,Dash 就会使用新的值调用回调函数 update_figure。该函数使用该新值过滤数据框,构造一个 figure 对象,并将其返回给 Dash 应用程序。
在这个例子中,有一些不错的思路。
- 我们使用 Pandas 库来导入和过滤内存中的数据集。
- 我们在应用开始时加载我们的 df:
df = pd.read_csv('...')。这个 df 在应用的全局状态下,可以在回调函数里面读取。 - 将数据加载到内存中是很昂贵的。通过在应用开始时加载查询数据,而不是在回调函数里面加载查询数据,我们可以确保这个操作只在应用服务器启动时完成。当用户访问应用程序或与应用程序交互时,该数据(df)已经在内存中。如果可能的话,昂贵的初始化(比如下载或查询数据)应该在应用的全局范围内完成,而不是在回调函数内完成。
- 回调不会修改原始数据,它只是通过 pandas 过滤器过滤来创建数据框架的副本。这一点很重要:你的回调永远不应该突变其范围外的变量。如果你的回调修改了全局状态,那么一个用户的会话可能会影响下一个用户的会话,当应用部署在多个进程或线程上时,这些修改不会在不同的会话之间共享。
- 我们正在使用
layout.transition开启过渡,以便让人了解数据集如何随着时间的推移而演变:过渡允许图表从一个状态平滑地更新到下一个状态,就像它是动画一样。其transition_duration=500参数表示过渡到下一个图表所需时间。
多输入
import dash
import dash_core_components as dcc
import dash_html_components as html
from dash.dependencies import Input, Output
import plotly.express as px

import pandas as pd

external_stylesheets = ['https://codepen.io/chriddyp/pen/bWLwgP.css']

app = dash.Dash(__name__, external_stylesheets=external_stylesheets)

df = pd.read_csv('https://plotly.github.io/datasets/country_indicators.csv')

available_indicators = df['Indicator Name'].unique()

app.layout = html.Div([
    html.Div([

        html.Div([
            dcc.Dropdown(
                id='xaxis-column',
                options=[{'label': i, 'value': i} for i in available_indicators],
                value='Fertility rate, total (births per woman)'
            ),
            dcc.RadioItems(
                id='xaxis-type',
                options=[{'label': i, 'value': i} for i in ['Linear', 'Log']],
                value='Linear',
                labelStyle={'display': 'inline-block'}
            )
        ],
        style={'width': '48%', 'display': 'inline-block'}),

        html.Div([
            dcc.Dropdown(
                id='yaxis-column',
                options=[{'label': i, 'value': i} for i in available_indicators],
                value='Life expectancy at birth, total (years)'
            ),
            dcc.RadioItems(
                id='yaxis-type',
                options=[{'label': i, 'value': i} for i in ['Linear', 'Log']],
                value='Linear',
                labelStyle={'display': 'inline-block'}
            )
        ],style={'width': '48%', 'float': 'right', 'display': 'inline-block'})
    ]),

    dcc.Graph(id='indicator-graphic'),

    dcc.Slider(
        id='year--slider',
        min=df['Year'].min(),
        max=df['Year'].max(),
        value=df['Year'].max(),
        marks={str(year): str(year) for year in df['Year'].unique()},
        step=None
    )
])

@app.callback(
    Output('indicator-graphic', 'figure'),
    [Input('xaxis-column', 'value'),
     Input('yaxis-column', 'value'),
     Input('xaxis-type', 'value'),
     Input('yaxis-type', 'value'),
     Input('year--slider', 'value')])
def update_graph(xaxis_column_name, yaxis_column_name,
                 xaxis_type, yaxis_type,
                 year_value):
    dff = df[df['Year'] == year_value]

    fig = px.scatter(x=dff[dff['Indicator Name'] == xaxis_column_name]['Value'],
                     y=dff[dff['Indicator Name'] == yaxis_column_name]['Value'],
                     hover_name=dff[dff['Indicator Name'] == yaxis_column_name]['Country Name'])

    fig.update_layout(margin={'l': 40, 'b': 40, 't': 10, 'r': 0}, hovermode='closest')

    fig.update_xaxes(title=xaxis_column_name,
                     type='linear' if xaxis_type == 'Linear' else 'log')

    fig.update_yaxes(title=yaxis_column_name,
                     type='linear' if yaxis_type == 'Linear' else 'log')

    return fig


if __name__ == '__main__':
    app.run_server(debug=True)
在这个例子中,每当 Dropdown、Slider 或 RadioItems 组件的值属性改变时, update_graph 函数就会被调用。
update_graph 函数的输入参数是每个 Input 属性的新值或当前值,按照它们被指定的顺序。
即使一次只改变一个单一的输入(用户在给定的时刻只能改变一个 Dropdown 的值),Dash 也会收集所有指定的输入属性的当前状态,并为您将它们传递到您的函数中。你的回调函数总是被保证传递给应用程序的代表状态。
让我们扩展我们的例子以包括多个输出。
多输出
到目前为止,我们写的所有回调都只更新一个输出属性。我们也可以同时更新几个属性:把所有要更新的属性作为一个列表放在装饰器中,然后从回调中返回这么多项目。如果两个输出依赖于同一个计算密集的中间结果,比如一个缓慢的数据库查询,就会表现得特别好。
import dash
import dash_core_components as dcc
import dash_html_components as html
from dash.dependencies import Input, Output

external_stylesheets = ['https://codepen.io/chriddyp/pen/bWLwgP.css']

app = dash.Dash(__name__, external_stylesheets=external_stylesheets)

app.layout = html.Div([
    dcc.Input(
        id='num-multi',
        type='number',
        value=5
    ),
    html.Table([
        html.Tr([html.Td(['x', html.Sup(2)]), html.Td(id='square')]),
        html.Tr([html.Td(['x', html.Sup(3)]), html.Td(id='cube')]),
        html.Tr([html.Td([2, html.Sup('x')]), html.Td(id='twos')]),
        html.Tr([html.Td([3, html.Sup('x')]), html.Td(id='threes')]),
        html.Tr([html.Td(['x', html.Sup('x')]), html.Td(id='x^x')]),
    ]),
])


@app.callback(
    [Output('square', 'children'),
     Output('cube', 'children'),
     Output('twos', 'children'),
     Output('threes', 'children'),
     Output('x^x', 'children')],
    [Input('num-multi', 'value')])
def callback_a(x):
    return x**2, x**3, 2**x, 3**x, x**x


if __name__ == '__main__':
    app.run_server(debug=True)
需要提醒的是:即使可以合并输出,也不一定是个好主意。
如果输出依赖于一些而不是所有相同的 Inputs,将它们分开可以避免不必要的更新。如果它们有相同的 Inputs,但用这些 Inputs 做独立的计算,保持回调分离可以让它们并行运行。
链式回调
你也可以将输出和输入链在一起:一个回调函数的输出可以是另一个回调函数的输入。
这种模式可以用来创建动态用户界面,其中一个输入组件更新下一个输入组件的可用选项。下面是一个简单的例子。
# -*- coding: utf-8 -*-
import dash
import dash_core_components as dcc
import dash_html_components as html
from dash.dependencies import Input, Output

external_stylesheets = ['https://codepen.io/chriddyp/pen/bWLwgP.css']

app = dash.Dash(__name__, external_stylesheets=external_stylesheets)

all_options = {
    'America': ['New York City', 'San Francisco', 'Cincinnati'],
    'Canada': [u'Montréal', 'Toronto', 'Ottawa']
}
app.layout = html.Div([
    dcc.RadioItems(
        id='countries-radio',
        options=[{'label': k, 'value': k} for k in all_options.keys()],
        value='America'
    ),

    html.Hr(),

    dcc.RadioItems(id='cities-radio'),

    html.Hr(), # 横线

    html.Div(id='display-selected-values')
])


@app.callback(
    Output('cities-radio', 'options'),
    [Input('countries-radio', 'value')])
def set_cities_options(selected_country):
    return [{'label': i, 'value': i} for i in all_options[selected_country]]


@app.callback(
    Output('cities-radio', 'value'),
    [Input('cities-radio', 'options')])
def set_cities_value(available_options):
    return available_options[0]['value']


@app.callback(
    Output('display-selected-values', 'children'),
    [Input('countries-radio', 'value'),
     Input('cities-radio', 'value')])
def set_display_children(selected_country, selected_city):
    return u'{} is a city in {}'.format(
        selected_city, selected_country,
    )


if __name__ == '__main__':
    app.run_server(debug=True)
第一个回调根据第一个 RadioItems 组件中的选择值更新第二个 RadioItems 组件中的可用选项。
第二个回调在选项属性改变时设置一个初始值:它将其设置为该选项数组中的第一个值。
最后一个回调显示每个组件的选定值。如果您更改了 countries RadioItems 组件的值,Dash 将等待直到 cities 组件的值更新后再调用最终回调。这可以防止你的回调被调用时状态不一致,比如 "America "和 "Montréal"。
状态
在某些情况下,你可能会在你的应用程序中使用一个 "表单 "类型的模式。在这种情况下,你可能想读取输入组件的值,但只有当用户完成了他或她在表单中的所有信息输入时才会读取。
直接给输入值附加一个回调可以实现这一点。
# -*- coding: utf-8 -*-
import dash
import dash_core_components as dcc
import dash_html_components as html
from dash.dependencies import Input, Output

external_stylesheets = ["https://codepen.io/chriddyp/pen/bWLwgP.css"]

app = dash.Dash(__name__, external_stylesheets=external_stylesheets)

app.layout = html.Div(
    [
        dcc.Input(id="input-1", type="text", value="Montréal"),
        dcc.Input(id="input-2", type="text", value="Canada"),
        html.Div(id="number-output"),
    ]
)


@app.callback(
    Output("number-output", "children"),
    [Input("input-1", "value"), Input("input-2", "value")],
)
def update_output(input1, input2):
    return u'Input 1 is "{}" and Input 2 is "{}"'.format(input1, input2)


if __name__ == "__main__":
    app.run_server(debug=True)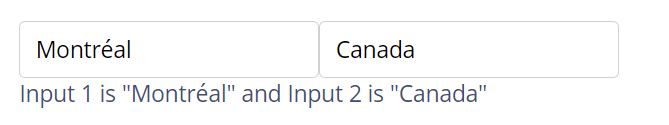
在这个例子中,每当 dash.dependencies.Input 描述的任何属性发生变化时,回调函数就会被触发。你可以在上面的输入中输入数据来试试。
dash.dependencies.State 允许你在不触发回调的情况下传递额外的值。这里的例子和上面的一样,但是把 dcc.Input 作为 dash.dependencies.State,把按钮作为 dash.dependencies.Input。
# -*- coding: utf-8 -*-
import dash
import dash_core_components as dcc
import dash_html_components as html
from dash.dependencies import Input, Output, State

external_stylesheets = ['https://codepen.io/chriddyp/pen/bWLwgP.css']

app = dash.Dash(__name__, external_stylesheets=external_stylesheets)

app.layout = html.Div([
    dcc.Input(id='input-1-state', type='text', value='Montréal'),
    dcc.Input(id='input-2-state', type='text', value='Canada'),
    html.Button(id='submit-button-state', n_clicks=0, children='Submit'),
    html.Div(id='output-state')
])


@app.callback(Output('output-state', 'children'),
              [Input('submit-button-state', 'n_clicks')],
              [State('input-1-state', 'value'),
               State('input-2-state', 'value')])
def update_output(n_clicks, input1, input2):
    return u'''
        The Button has been pressed {} times,
        Input 1 is "{}",
        and Input 2 is "{}"
    '''.format(n_clicks, input1, input2)


if __name__ == '__main__':
    app.run_server(debug=True)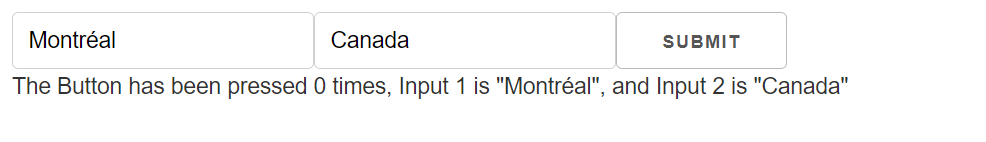
在这个例子中,改变 dcc.Input 框中的文本不会触发回调,但点击按钮会。尽管 dcc.Input 值的当前值没有触发回调函数本身,但它们仍然会被传递到回调中。
请注意,我们是通过监听 html.Button 组件的 n_clicks 属性来触发回调的。n_clicks 是一个每次组件被单击时都会递增的属性。dash_html_components 库中的每个组件都有这个属性。
可交互式可视化
可交互式作图
dash_core_components 库中包含一个名为 Graph 的组件。
Graph 使用开源的 plotly.js JavaScript 图形库来渲染交互式数据可视化。Plotly.js 支持超过 35 种图表类型,并以矢量质量的 SVG 和高性能的 WebGL 渲染图表。
dash_core_components.Graph 组件中的 figure 参数与 Plotly 的开源 Python 图表库 plotly.py 使用的 figure 参数相同。查看 plotly.py 文档和图库以了解更多。
Dash 组件由一组属性声明性地描述。所有这些属性都可以通过回调函数更新,但只有一个子集的属性是通过用户交互更新的,比如当你点击 dcc.Dropdown 组件中的一个选项时,该组件的值属性就会改变。
dcc.Graph 组件有四个属性可以通过用户交互来改变:hoverData、clickData、selectedData、 relayoutData。当你将鼠标悬停在点上,点击点,或者选择图形中的点的区域时,这些属性就会更新。
import json

import dash
import dash_core_components as dcc
import dash_html_components as html
from dash.dependencies import Input, Output
import plotly.express as px
import pandas as pd

external_stylesheets = ['https://codepen.io/chriddyp/pen/bWLwgP.css']

app = dash.Dash(__name__, external_stylesheets=external_stylesheets)

styles = {
    'pre': {
        'border': 'thin lightgrey solid',
        'overflowX': 'scroll'
    }
}

df = pd.DataFrame({
    "x": [1,2,1,2],
    "y": [1,2,3,4],
    "customdata": [1,2,3,4],
    "fruit": ["apple", "apple", "orange", "orange"]
})

fig = px.scatter(df, x="x", y="y", color="fruit", custom_data=["customdata"])

fig.update_layout(clickmode='event+select')

fig.update_traces(marker_size=20)

app.layout = html.Div([
    dcc.Graph(
        id='basic-interactions',
        figure=fig
    ),

    html.Div(className='row', children=[
        html.Div([
            dcc.Markdown("""
                **Hover Data**

                Mouse over values in the graph.
            """),
            html.Pre(id='hover-data', style=styles['pre'])
        ], className='three columns'),

        html.Div([
            dcc.Markdown("""
                **Click Data**

                Click on points in the graph.
            """),
            html.Pre(id='click-data', style=styles['pre']),
        ], className='three columns'),

        html.Div([
            dcc.Markdown("""
                **Selection Data**

                Choose the lasso or rectangle tool in the graph's menu
                bar and then select points in the graph.

                Note that if `layout.clickmode = 'event+select'`, selection data also
                accumulates (or un-accumulates) selected data if you hold down the shift
                button while clicking.
            """),
            html.Pre(id='selected-data', style=styles['pre']),
        ], className='three columns'),

        html.Div([
            dcc.Markdown("""
                **Zoom and Relayout Data**

                Click and drag on the graph to zoom or click on the zoom
                buttons in the graph's menu bar.
                Clicking on legend items will also fire
                this event.
            """),
            html.Pre(id='relayout-data', style=styles['pre']),
        ], className='three columns')
    ])
])


@app.callback(
    Output('hover-data', 'children'),
    [Input('basic-interactions', 'hoverData')])
def display_hover_data(hoverData):
    return json.dumps(hoverData, indent=2)


@app.callback(
    Output('click-data', 'children'),
    [Input('basic-interactions', 'clickData')])
def display_click_data(clickData):
    return json.dumps(clickData, indent=2)


@app.callback(
    Output('selected-data', 'children'),
    [Input('basic-interactions', 'selectedData')])
def display_selected_data(selectedData):
    return json.dumps(selectedData, indent=2)


@app.callback(
    Output('relayout-data', 'children'),
    [Input('basic-interactions', 'relayoutData')])
def display_relayout_data(relayoutData):
    return json.dumps(relayoutData, indent=2)


if __name__ == '__main__':
    app.run_server(debug=True)
Update Graphs on Hover
import dash
import dash_core_components as dcc
import dash_html_components as html
import pandas as pd
import plotly.express as px

external_stylesheets = ['https://codepen.io/chriddyp/pen/bWLwgP.css']

app = dash.Dash(__name__, external_stylesheets=external_stylesheets)

df = pd.read_csv('https://cdn.jsdelivr.net/gh/plotly/datasets/country_indicators.csv')

available_indicators = df['Indicator Name'].unique()

app.layout = html.Div([
    html.Div([

        html.Div([
            dcc.Dropdown(
                id='crossfilter-xaxis-column',
                options=[{'label': i, 'value': i} for i in available_indicators],
                value='Fertility rate, total (births per woman)'
            ),
            dcc.RadioItems(
                id='crossfilter-xaxis-type',
                options=[{'label': i, 'value': i} for i in ['Linear', 'Log']],
                value='Linear',
                labelStyle={'display': 'inline-block'}
            )
        ],
        style={'width': '49%', 'display': 'inline-block'}),

        html.Div([
            dcc.Dropdown(
                id='crossfilter-yaxis-column',
                options=[{'label': i, 'value': i} for i in available_indicators],
                value='Life expectancy at birth, total (years)'
            ),
            dcc.RadioItems(
                id='crossfilter-yaxis-type',
                options=[{'label': i, 'value': i} for i in ['Linear', 'Log']],
                value='Linear',
                labelStyle={'display': 'inline-block'}
            )
        ], style={'width': '49%', 'float': 'right', 'display': 'inline-block'})
    ], style={
        'borderBottom': 'thin lightgrey solid',
        'backgroundColor': 'rgb(250, 250, 250)',
        'padding': '10px 5px'
    }),

    html.Div([
        dcc.Graph(
            id='crossfilter-indicator-scatter',
            hoverData={'points': [{'customdata': 'Japan'}]}
        )
    ], style={'width': '49%', 'display': 'inline-block', 'padding': '0 20'}),
    html.Div([
        dcc.Graph(id='x-time-series'),
        dcc.Graph(id='y-time-series'),
    ], style={'display': 'inline-block', 'width': '49%'}),

    html.Div(dcc.Slider(
        id='crossfilter-year--slider',
        min=df['Year'].min(),
        max=df['Year'].max(),
        value=df['Year'].max(),
        marks={str(year): str(year) for year in df['Year'].unique()},
        step=None
    ), style={'width': '49%', 'padding': '0px 20px 20px 20px'})
])


@app.callback(
    dash.dependencies.Output('crossfilter-indicator-scatter', 'figure'),
    [dash.dependencies.Input('crossfilter-xaxis-column', 'value'),
     dash.dependencies.Input('crossfilter-yaxis-column', 'value'),
     dash.dependencies.Input('crossfilter-xaxis-type', 'value'),
     dash.dependencies.Input('crossfilter-yaxis-type', 'value'),
     dash.dependencies.Input('crossfilter-year--slider', 'value')])
def update_graph(xaxis_column_name, yaxis_column_name,
                 xaxis_type, yaxis_type,
                 year_value):
    dff = df[df['Year'] == year_value]

    fig = px.scatter(x=dff[dff['Indicator Name'] == xaxis_column_name]['Value'],
            y=dff[dff['Indicator Name'] == yaxis_column_name]['Value'],
            hover_name=dff[dff['Indicator Name'] == yaxis_column_name]['Country Name']
            )

    fig.update_traces(customdata=dff[dff['Indicator Name'] == yaxis_column_name]['Country Name'])

    fig.update_xaxes(title=xaxis_column_name, type='linear' if xaxis_type == 'Linear' else 'log')

    fig.update_yaxes(title=yaxis_column_name, type='linear' if yaxis_type == 'Linear' else 'log')

    fig.update_layout(margin={'l': 40, 'b': 40, 't': 10, 'r': 0}, hovermode='closest')

    return fig


def create_time_series(dff, axis_type, title):

    fig = px.scatter(dff, x='Year', y='Value')

    fig.update_traces(mode='lines+markers')

    fig.update_xaxes(showgrid=False)

    fig.update_yaxes(type='linear' if axis_type == 'Linear' else 'log')

    fig.add_annotation(x=0, y=0.85, xanchor='left', yanchor='bottom',
                       xref='paper', yref='paper', showarrow=False, align='left',
                       bgcolor='rgba(255, 255, 255, 0.5)', text=title)

    fig.update_layout(height=225, margin={'l': 20, 'b': 30, 'r': 10, 't': 10})

    return fig


@app.callback(
    dash.dependencies.Output('x-time-series', 'figure'),
    [dash.dependencies.Input('crossfilter-indicator-scatter', 'hoverData'),
     dash.dependencies.Input('crossfilter-xaxis-column', 'value'),
     dash.dependencies.Input('crossfilter-xaxis-type', 'value')])
def update_y_timeseries(hoverData, xaxis_column_name, axis_type):
    country_name = hoverData['points'][0]['customdata']
    dff = df[df['Country Name'] == country_name]
    dff = dff[dff['Indicator Name'] == xaxis_column_name]
    title = '<b>{}</b><br>{}'.format(country_name, xaxis_column_name)
    return create_time_series(dff, axis_type, title)


@app.callback(
    dash.dependencies.Output('y-time-series', 'figure'),
    [dash.dependencies.Input('crossfilter-indicator-scatter', 'hoverData'),
     dash.dependencies.Input('crossfilter-yaxis-column', 'value'),
     dash.dependencies.Input('crossfilter-yaxis-type', 'value')])
def update_x_timeseries(hoverData, yaxis_column_name, axis_type):
    dff = df[df['Country Name'] == hoverData['points'][0]['customdata']]
    dff = dff[dff['Indicator Name'] == yaxis_column_name]
    return create_time_series(dff, axis_type, yaxis_column_name)


if __name__ == '__main__':
    app.run_server(debug=True)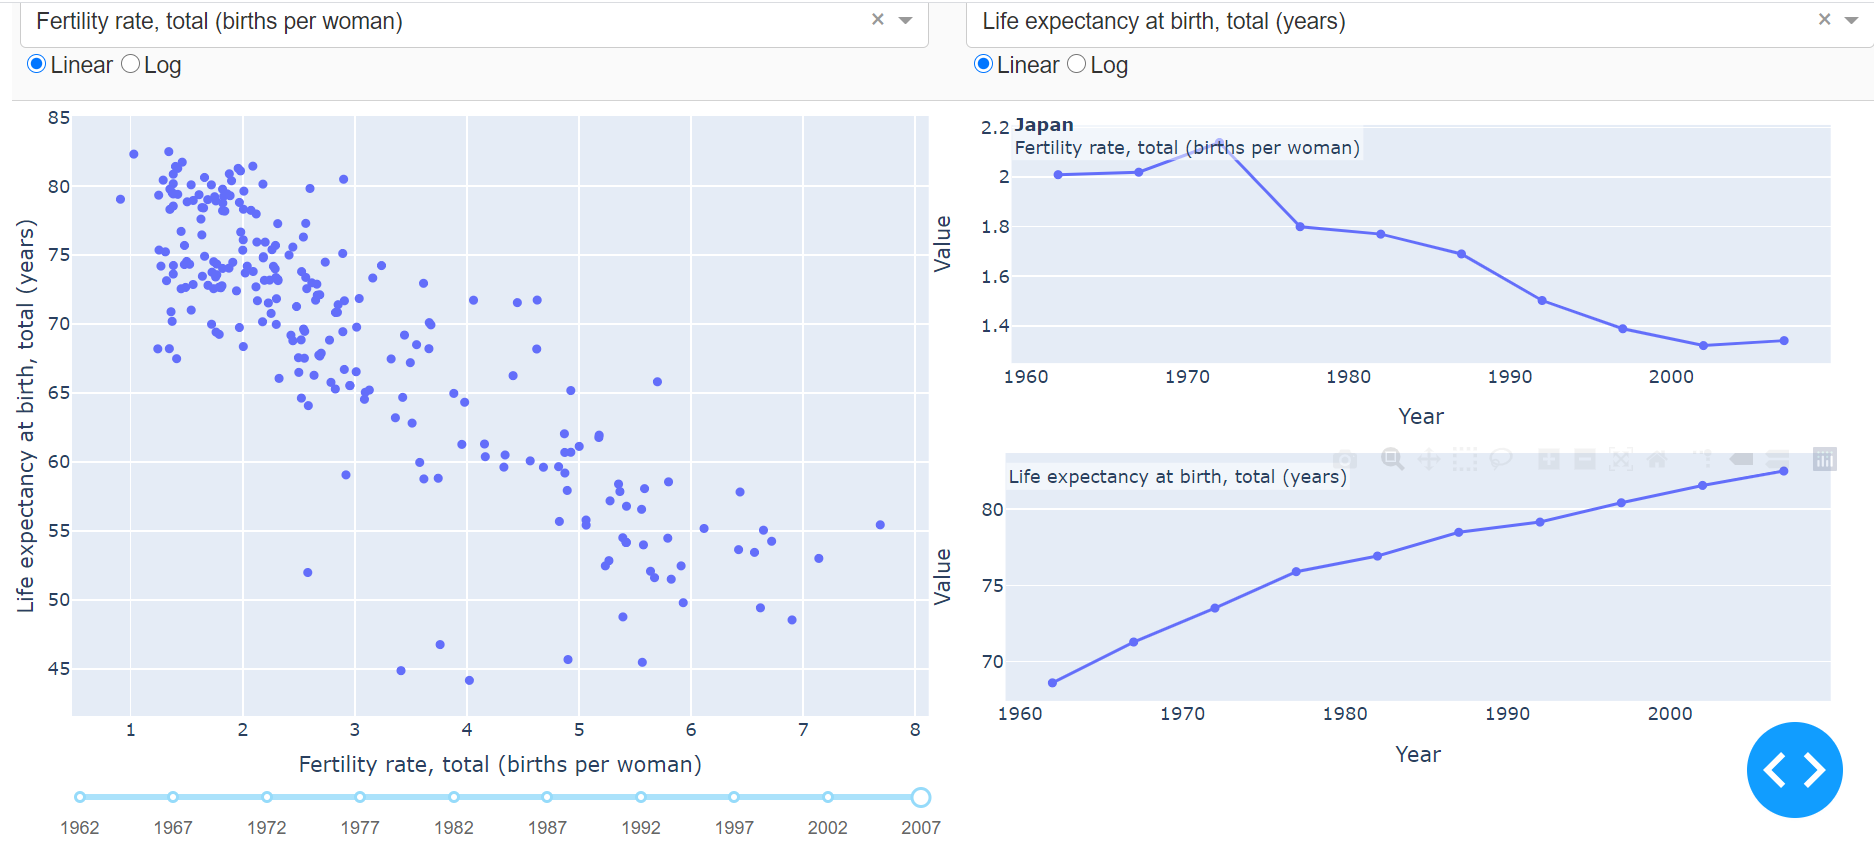
试着将鼠标放在左边散点图中的点上。注意右边的线图是如何根据你悬停的点进行更新的。
交叉过滤
import dash
import dash_core_components as dcc
import dash_html_components as html
import numpy as np
import pandas as pd
from dash.dependencies import Input, Output
import plotly.express as px

external_stylesheets = ['https://codepen.io/chriddyp/pen/bWLwgP.css']

app = dash.Dash(__name__, external_stylesheets=external_stylesheets)

# make a sample data frame with 6 columns
np.random.seed(0)
df = pd.DataFrame({"Col " + str(i+1): np.random.rand(30) for i in range(6)})

app.layout = html.Div([
    html.Div(
        dcc.Graph(id='g1', config={'displayModeBar': False}),
        className='four columns'
    ),
    html.Div(
        dcc.Graph(id='g2', config={'displayModeBar': False}),
        className='four columns'
        ),
    html.Div(
        dcc.Graph(id='g3', config={'displayModeBar': False}),
        className='four columns'
    )
], className='row')

def get_figure(df, x_col, y_col, selectedpoints, selectedpoints_local):

    if selectedpoints_local and selectedpoints_local['range']:
        ranges = selectedpoints_local['range']
        selection_bounds = {'x0': ranges['x'][0], 'x1': ranges['x'][1],
                            'y0': ranges['y'][0], 'y1': ranges['y'][1]}
    else:
        selection_bounds = {'x0': np.min(df[x_col]), 'x1': np.max(df[x_col]),
                            'y0': np.min(df[y_col]), 'y1': np.max(df[y_col])}

    # set which points are selected with the `selectedpoints` property
    # and style those points with the `selected` and `unselected`
    # attribute. see
    # https://medium.com/@plotlygraphs/notes-from-the-latest-plotly-js-release-b035a5b43e21
    # for an explanation
    fig = px.scatter(df, x=df[x_col], y=df[y_col], text=df.index)

    fig.update_traces(selectedpoints=selectedpoints,
                      customdata=df.index,
                      mode='markers+text', marker={ 'color': 'rgba(0, 116, 217, 0.7)', 'size': 20 }, unselected={'marker': { 'opacity': 0.3 }, 'textfont': { 'color': 'rgba(0, 0, 0, 0)' }})

    fig.update_layout(margin={'l': 20, 'r': 0, 'b': 15, 't': 5}, dragmode='select', hovermode=False)

    fig.add_shape(dict({'type': 'rect',
                        'line': { 'width': 1, 'dash': 'dot', 'color': 'darkgrey' }},
                       **selection_bounds))
    return fig

# this callback defines 3 figures
# as a function of the intersection of their 3 selections
@app.callback(
    [Output('g1', 'figure'),
     Output('g2', 'figure'),
     Output('g3', 'figure')],
    [Input('g1', 'selectedData'),
     Input('g2', 'selectedData'),
     Input('g3', 'selectedData')]
)
def callback(selection1, selection2, selection3):
    selectedpoints = df.index
    for selected_data in [selection1, selection2, selection3]:
        if selected_data and selected_data['points']:
            selectedpoints = np.intersect1d(selectedpoints,
                [p['customdata'] for p in selected_data['points']])

    return [get_figure(df, "Col 1", "Col 2", selectedpoints, selection1),
            get_figure(df, "Col 3", "Col 4", selectedpoints, selection2),
            get_figure(df, "Col 5", "Col 6", selectedpoints, selection3)]


if __name__ == '__main__':
    app.run_server(debug=True)
试着在任何一个图中点击并拖动以过滤不同的区域。在每次选择时,三个图形回调都会与每个图的最新选定区域一起启动。pandas 数据框会根据所选点进行过滤,并重新绘制图形,高亮显示所选点,并将所选区域画成虚线矩形。
回调间共享数据
在回调入门指南中提到,Dash 核心原则之一是 Dash 回调决不能修改其作用域之外的变量。修改任何全局变量都是不安全的。本章解释了为什么,并提供了一些在回调之间共享状态的替代模式。
为什么分享状态?
在某些应用程序中,您可能有多个回调,这些回调依赖于昂贵的数据处理任务,如进行 SQL 查询、运行模拟或下载数据。
与其让每个回调运行同样昂贵的任务,不如让一个回调运行任务,然后将结果分享给其他回调。
现在这种需求已经得到了一定的改善,你可以为一个回调设置多个输出。这样一来,那个昂贵的任务就可以做一次,并立即用于所有的输出。但是在某些情况下,这仍然不是很理想,比如说如果有简单的后续任务修改结果,比如单位转换。我们不应该为了把结果从华氏度改成摄氏度而重复一个大型数据库查询!
为什么全局变量会打断你的 app?
Dash 被设计为在多用户环境中工作,在这种环境中,多人可能会同时查看应用程序,并且会有独立的会话。
如果您的应用程序使用修改过的全局变量,那么一个用户的会话可以将变量设置为一个值,这将影响下一个用户的会话。
Dash 还被设计成能够与多个 python Worker 一起运行,这样回调就可以并行执行。这通常是通过使用 gunicorn 来实现的,使用的语法包括
$ gunicorn --workers 4 app:server(app refers to a file named app.py and server refers to a variable in that file named server: server = app.server).
当 Dash 应用程序在多个 Worker 之间运行时,它们的内存是不共享的。这意味着,如果您在一个回调中修改了全局变量,则该修改将不会应用于其他 Worker。
这里是一个应用程序的草图,它有一个回调,可以修改其范围外的数据。由于上述原因,这种类型的模式*不会可靠地工作
df = pd.DataFrame({
    'a': [1, 2, 3],
    'b': [4, 1, 4],
    'c': ['x', 'y', 'z'],
})

app.layout = html.Div([
    dcc.Dropdown(
        id='dropdown',
        options=[{'label': i, 'value': i} for i in df['c'].unique()],
        value='a'
    ),
    html.Div(id='output'),
])

@app.callback(Output('output', 'children'),
              [Input('dropdown', 'value')])
def update_output_1(value):
    # Here, `df` is an example of a variable that is
    # "outside the scope of this function".
    # *It is not safe to modify or reassign this variable
    #  inside this callback.*
    global df = df[df['c'] == value]  # do not do this, this is not safe!
    return len(df)
要修复这个例子,只需将过滤器重新分配到回调内的一个新变量,或者遵循本指南下一部分中概述的策略之一。
df = pd.DataFrame({
    'a': [1, 2, 3],
    'b': [4, 1, 4],
    'c': ['x', 'y', 'z'],
})

app.layout = html.Div([
    dcc.Dropdown(
        id='dropdown',
        options=[{'label': i, 'value': i} for i in df['c'].unique()],
        value='a'
    ),
    html.Div(id='output'),
])

@app.callback(Output('output', 'children'),
              [Input('dropdown', 'value')])
def update_output_1(value):
    # Safely reassign the filter to a new variable
    filtered_df = df[df['c'] == value]
    return len(filtered_df)
回调间共享数据
为了在多个 python 进程之间安全地共享数据,我们需要将数据存储在每个进程都能访问的地方。
有三个主要的地方可以存储这些数据。
1 - 在用户的浏览器会话中
2 - 在磁盘上(例如,在一个文件或新的数据库上)。
3 - 在共享内存空间中,比如 Redis。
以下三个例子说明了这些方法。
案例 1:在浏览器中使用隐藏的 Div 存储数据。
- 通过在 https://community.plotly.com/t/sharing-a-dataframe-between-plots/6173 中解释的方法将数据保存为 Dash 前端存储的一部分来实现。
- 数据必须转换为 JSON 这样的字符串进行存储和传输。
以这种方式缓存的数据将只在用户当前会话中可用。
- 如果你打开一个新的浏览器,应用程序的回调将始终计算数据。数据只在会话内的回调之间进行缓存和传输。
- 因此,与缓存不同,这种方法不会增加应用程序的内存占用。
- 在网络传输方面可能会有成本。如果你在回调之间共享 10MB 的数据,那么这些数据将在每个回调之间通过网络传输。
- 如果网络成本太高,那就在前期计算聚合并传输这些。你的应用很可能不会显示 10MB 的数据,它只是显示其中的一个子集或聚合。
这个例子概述了如何在一个回调中执行一个昂贵的数据处理步骤,将输出序列化为 JSON,并将其作为输入提供给其他回调。这个例子使用标准的 Dash 回调,并将 JSON 化的数据存储在应用程序中的一个隐藏的 div 中。
global_df = pd.read_csv('...')
app.layout = html.Div([
    dcc.Graph(id='graph'),
    html.Table(id='table'),
    dcc.Dropdown(id='dropdown'),

    # Hidden div inside the app that stores the intermediate value
    html.Div(id='intermediate-value', style={'display': 'none'})
])

@app.callback(Output('intermediate-value', 'children'), [Input('dropdown', 'value')])
def clean_data(value):
     # some expensive clean data step
     cleaned_df = your_expensive_clean_or_compute_step(value)

     # more generally, this line would be
     # json.dumps(cleaned_df)
     return cleaned_df.to_json(date_format='iso', orient='split')

@app.callback(Output('graph', 'figure'), [Input('intermediate-value', 'children')])
def update_graph(jsonified_cleaned_data):

    # more generally, this line would be
    # json.loads(jsonified_cleaned_data)
    dff = pd.read_json(jsonified_cleaned_data, orient='split')

    figure = create_figure(dff)
    return figure

@app.callback(Output('table', 'children'), [Input('intermediate-value', 'children')])
def update_table(jsonified_cleaned_data):
    dff = pd.read_json(jsonified_cleaned_data, orient='split')
    table = create_table(dff)
    return table
案例 2:预先计算
如果数据很大,通过网络发送计算数据可能会很昂贵。在某些情况下,将这些数据和 JSON 序列化也会很昂贵。
在许多情况下,您的应用程序将只显示计算或过滤数据的一个子集或聚合。在这些情况下,你可以在你的数据处理回调中预先计算你的聚合,并将这些聚合传输到其余回调中。
下面是一个简单的例子,说明如何将过滤的或聚合的数据传输到多个回调。
@app.callback(
    Output('intermediate-value', 'children'),
    [Input('dropdown', 'value')])
def clean_data(value):
     # an expensive query step
     cleaned_df = your_expensive_clean_or_compute_step(value)

     # a few filter steps that compute the data
     # as it's needed in the future callbacks
     df_1 = cleaned_df[cleaned_df['fruit'] == 'apples']
     df_2 = cleaned_df[cleaned_df['fruit'] == 'oranges']
     df_3 = cleaned_df[cleaned_df['fruit'] == 'figs']

     datasets = {
         'df_1': df_1.to_json(orient='split', date_format='iso'),
         'df_2': df_2.to_json(orient='split', date_format='iso'),
         'df_3': df_3.to_json(orient='split', date_format='iso'),
     }

     return json.dumps(datasets)

@app.callback(
    Output('graph', 'figure'),
    [Input('intermediate-value', 'children')])
def update_graph_1(jsonified_cleaned_data):
    datasets = json.loads(jsonified_cleaned_data)
    dff = pd.read_json(datasets['df_1'], orient='split')
    figure = create_figure_1(dff)
    return figure

@app.callback(
    Output('graph', 'figure'),
    [Input('intermediate-value', 'children')])
def update_graph_2(jsonified_cleaned_data):
    datasets = json.loads(jsonified_cleaned_data)
    dff = pd.read_json(datasets['df_2'], orient='split')
    figure = create_figure_2(dff)
    return figure

@app.callback(
    Output('graph', 'figure'),
    [Input('intermediate-value', 'children')])
def update_graph_3(jsonified_cleaned_data):
    datasets = json.loads(jsonified_cleaned_data)
    dff = pd.read_json(datasets['df_3'], orient='split')
    figure = create_figure_3(dff)
    return figure
案例 3:缓存和信号传递
这个例子:
- 通过 Flask -Cache 使用 Redis 来存储 "全局变量"。这些数据通过一个函数进行访问,函数的输出被缓存,并通过其输入参数进行键控。
- 当昂贵的计算完成后,使用隐藏的 div 方案向其他回调发送信号。
- 注意,你也可以不使用 Redis,而是将其保存到文件系统中。更多细节请参见 https://flask-caching.readthedocs.io/en/latest/。
- 这种 "信号传递 "很酷,因为它允许昂贵的计算只占用一个进程。如果没有这种类型的信令,每个回调最终可能会并行计算昂贵的计算,锁定四个进程而不是一个进程。
这种方法的优势还在于,未来的会话可以使用预先计算的值。这对于那些输入数量较少的应用来说,会有很好的效果。
下面是一个示例。一些需要注意的事情。
- 我通过使用 time.sleep(5)模拟了一个昂贵的过程。
- 当应用程序加载时,渲染所有四张图需要 5 秒。
- 初始计算只阻止了一个进程。
- 一旦计算完成,就会发送信号,并并行执行四个回调来渲染图形。每一个回调都会从 "全局存储":Redis 或文件系统缓存中检索数据。
- 我在 app.run_server 中设置了 processes=6,这样就可以并行执行多个回调。在生产中,可以使用类似 $ gunicorn --workers 6 --threads 2 app:server 这样的方法来完成。
- 如果过去已经选择了一个值,那么在下拉菜单中选择该值的时间将少于 5 秒。这是因为该值是从缓存中提取的。
- 同样,重新加载页面或在新窗口中打开应用程序也很快,因为初始状态和初始昂贵的计算已经被计算过了。
import os
import copy
import time
import datetime

import dash
import dash_core_components as dcc
import dash_html_components as html
import numpy as np
import pandas as pd
from dash.dependencies import Input, Output
from flask_caching import Cache


external_stylesheets = [
    # Dash CSS
    'https://codepen.io/chriddyp/pen/bWLwgP.css',
    # Loading screen CSS
    'https://codepen.io/chriddyp/pen/brPBPO.css']

app = dash.Dash(__name__, external_stylesheets=external_stylesheets)
CACHE_CONFIG = {
    # try 'filesystem' if you don't want to setup redis
    'CACHE_TYPE': 'redis',
    'CACHE_REDIS_URL': os.environ.get('REDIS_URL', 'redis://localhost:6379')
}
cache = Cache()
cache.init_app(app.server, config=CACHE_CONFIG)

N = 100

df = pd.DataFrame({
    'category': (
        (['apples'] * 5 * N) +
        (['oranges'] * 10 * N) +
        (['figs'] * 20 * N) +
        (['pineapples'] * 15 * N)
    )
})
df['x'] = np.random.randn(len(df['category']))
df['y'] = np.random.randn(len(df['category']))

app.layout = html.Div([
    dcc.Dropdown(
        id='dropdown',
        options=[{'label': i, 'value': i} for i in df['category'].unique()],
        value='apples'
    ),
    html.Div([
        html.Div(dcc.Graph(id='graph-1'), className="six columns"),
        html.Div(dcc.Graph(id='graph-2'), className="six columns"),
    ], className="row"),
    html.Div([
        html.Div(dcc.Graph(id='graph-3'), className="six columns"),
        html.Div(dcc.Graph(id='graph-4'), className="six columns"),
    ], className="row"),

    # hidden signal value
    html.Div(id='signal', style={'display': 'none'})
])


# perform expensive computations in this "global store"
# these computations are cached in a globally available
# redis memory store which is available across processes
# and for all time.
@cache.memoize()
def global_store(value):
    # simulate expensive query
    print('Computing value with {}'.format(value))
    time.sleep(5)
    return df[df['category'] == value]


def generate_figure(value, figure):
    fig = copy.deepcopy(figure)
    filtered_dataframe = global_store(value)
    fig['data'][0]['x'] = filtered_dataframe['x']
    fig['data'][0]['y'] = filtered_dataframe['y']
    fig['layout'] = {'margin': {'l': 20, 'r': 10, 'b': 20, 't': 10}}
    return fig


@app.callback(Output('signal', 'children'), [Input('dropdown', 'value')])
def compute_value(value):
    # compute value and send a signal when done
    global_store(value)
    return value


@app.callback(Output('graph-1', 'figure'), [Input('signal', 'children')])
def update_graph_1(value):
    # generate_figure gets data from `global_store`.
    # the data in `global_store` has already been computed
    # by the `compute_value` callback and the result is stored
    # in the global redis cached
    return generate_figure(value, {
        'data': [{
            'type': 'scatter',
            'mode': 'markers',
            'marker': {
                'opacity': 0.5,
                'size': 14,
                'line': {'border': 'thin darkgrey solid'}
            }
        }]
    })


@app.callback(Output('graph-2', 'figure'), [Input('signal', 'children')])
def update_graph_2(value):
    return generate_figure(value, {
        'data': [{
            'type': 'scatter',
            'mode': 'lines',
            'line': {'shape': 'spline', 'width': 0.5},
        }]
    })


@app.callback(Output('graph-3', 'figure'), [Input('signal', 'children')])
def update_graph_3(value):
    return generate_figure(value, {
        'data': [{
            'type': 'histogram2d',
        }]
    })


@app.callback(Output('graph-4', 'figure'), [Input('signal', 'children')])
def update_graph_4(value):
    return generate_figure(value, {
        'data': [{
            'type': 'histogram2dcontour',
        }]
    })


if __name__ == '__main__':
    app.run_server(debug=True, processes=6)
案例 4:服务器上基于用户的会话数据
实时更新数据
dash_core_components.Interval component 组件
Dash 中的组件通常通过用户交互来更新:选择下拉、拖动滑块、悬停在点上。
如果您正在构建一个用于监控的应用程序,您可能希望每隔几秒或几分钟更新一次应用程序中的组件。
dash_core_components.Interval 元素允许你在预定义的时间间隔上更新组件。n_intervals 属性是一个整数,每次间隔的毫秒数过后都会自动递增。您可以在应用程序的回调中监听这个变量,以便在预定义的时间间隔上启动回调。
这个例子从实时卫星馈送中提取数据,并每秒钟更新一次图表和文本。
import datetime

import dash
import dash_core_components as dcc
import dash_html_components as html
import plotly
from dash.dependencies import Input, Output

# pip install pyorbital
from pyorbital.orbital import Orbital
satellite = Orbital('TERRA')

external_stylesheets = ['https://codepen.io/chriddyp/pen/bWLwgP.css']

app = dash.Dash(__name__, external_stylesheets=external_stylesheets)
app.layout = html.Div(
    html.Div([
        html.H4('TERRA Satellite Live Feed'),
        html.Div(id='live-update-text'),
        dcc.Graph(id='live-update-graph'),
        dcc.Interval(
            id='interval-component',
            interval=5*1000, # 5秒钟间隔
            n_intervals=0
        )
    ])
)


@app.callback(Output('live-update-text', 'children'),
              [Input('interval-component', 'n_intervals')])
def update_metrics(n):
    lon, lat, alt = satellite.get_lonlatalt(datetime.datetime.now())
    style = {'padding': '5px', 'fontSize': '16px'}
    return [
        html.Span('Longitude: {0:.2f}'.format(lon), style=style),
        html.Span('Latitude: {0:.2f}'.format(lat), style=style),
        html.Span('Altitude: {0:0.2f}'.format(alt), style=style)
    ]


# Multiple components can update everytime interval gets fired.
@app.callback(Output('live-update-graph', 'figure'),
              [Input('interval-component', 'n_intervals')])
def update_graph_live(n):
    satellite = Orbital('TERRA')
    data = {
        'time': [],
        'Latitude': [],
        'Longitude': [],
        'Altitude': []
    }

    # Collect some data
    for i in range(180):
        time = datetime.datetime.now() - datetime.timedelta(seconds=i*20)
        lon, lat, alt = satellite.get_lonlatalt(
            time
        )
        data['Longitude'].append(lon)
        data['Latitude'].append(lat)
        data['Altitude'].append(alt)
        data['time'].append(time)

    # Create the graph with subplots
    fig = plotly.tools.make_subplots(rows=2, cols=1, vertical_spacing=0.2)
    fig['layout']['margin'] = {
        'l': 30, 'r': 10, 'b': 30, 't': 10
    }
    fig['layout']['legend'] = {'x': 0, 'y': 1, 'xanchor': 'left'}

    fig.append_trace({
        'x': data['time'],
        'y': data['Altitude'],
        'name': 'Altitude',
        'mode': 'lines+markers',
        'type': 'scatter'
    }, 1, 1)
    fig.append_trace({
        'x': data['Longitude'],
        'y': data['Latitude'],
        'text': data['time'],
        'name': 'Longitude vs Latitude',
        'mode': 'lines+markers',
        'type': 'scatter'
    }, 2, 1)

    return fig


if __name__ == '__main__':
    app.run_server(debug=True)
上面说过,我们不能修改全局变量,但当全局变量是个字典时,你可以用它来存储新增的数据,以此实现依赖上一个数据计算的情况。比如:
data = {
    'time': [],
    'Latitude': [],
    'Longitude': [],
    'Altitude': []
}

# Multiple components can update everytime interval gets fired.
@app.callback(Output('live-update-graph', 'figure'),
              [Input('interval-component', 'n_intervals')])
def update_graph_live(n):
    satellite = Orbital('TERRA')


    # Collect some data
    time = datetime.datetime.now() - datetime.timedelta(seconds=i*20)
    lon, lat, alt = satellite.get_lonlatalt(
        time
    )
    data['Longitude'].append(lon)
    data['Latitude'].append(lat)
    data['Altitude'].append(alt)
    data['time'].append(time)

    # Create the graph with subplots
    fig = plotly.tools.make_subplots(rows=2, cols=1, vertical_spacing=0.2)
    fig['layout']['margin'] = {
        'l': 30, 'r': 10, 'b': 30, 't': 10
    }
    fig['layout']['legend'] = {'x': 0, 'y': 1, 'xanchor': 'left'}

    fig.append_trace({
        'x': data['time'],
        'y': data['Altitude'],
        'name': 'Altitude',
        'mode': 'lines+markers',
        'type': 'scatter'
    }, 1, 1)
    fig.append_trace({
        'x': data['Longitude'],
        'y': data['Latitude'],
        'text': data['time'],
        'name': 'Longitude vs Latitude',
        'mode': 'lines+markers',
        'type': 'scatter'
    }, 2, 1)

    return fig


if __name__ == '__main__':
    app.run_server(debug=True)
页面加载的更新
默认情况下,Dash 应用程序会将 app.layout 存储在内存中。这可确保布局只在应用程序启动时计算一次。
如果您将 app.layout 设置为函数,那么您可以在每次页面加载时提供动态布局。
例如,如果您的 app.layout 看起来像这样。
import datetime

import dash
import dash_html_components as html

app.layout = html.H1('The time is: ' + str(datetime.datetime.now()))

if __name__ == '__main__':
    app.run_server(debug=True)
那么你的应用程序将显示应用程序启动时的时间。
如果你把它改为函数,那么每次刷新页面时都会计算出一个新的日期时间。试试吧。
提高性能
缓存
由于 Dash 的回调在本质上是函数式的(它们不包含任何状态),所以很容易添加 memoization 缓存。Memoization 会在函数被调用后存储它的结果,并且如果用相同的参数调用该函数,则会重新使用该结果。
Dash 应用程序经常跨多个进程或线程部署。在这些情况下,每个进程或线程都包含自己的内存,它不会跨实例共享内存。这意味着,如果我们要使用 lru_cache,我们的缓存结果可能不会在各个会话之间共享。
取而代之的是,我们可以使用 Flask-Caching 库,它可以将结果保存在共享内存数据库中,比如 Redis,或者作为文件系统中的文件。Flask-Caching 还有其他不错的功能,比如基于时间的过期。如果你想每小时或每天更新数据(清除缓存),基于时间的过期是很有用的。
下面是一个使用 Redis 的 Flask-Caching 的例子。
import datetime
import os

import dash
import dash_core_components as dcc
import dash_html_components as html
from dash.dependencies import Input, Output
from flask_caching import Cache

external_stylesheets = ['https://codepen.io/chriddyp/pen/bWLwgP.css']

app = dash.Dash(__name__, external_stylesheets=external_stylesheets)
cache = Cache(app.server, config={
    # try 'filesystem' if you don't want to setup redis
    'CACHE_TYPE': 'redis',
    'CACHE_REDIS_URL': os.environ.get('REDIS_URL', '')
})
app.config.suppress_callback_exceptions = True

timeout = 20
app.layout = html.Div([
    html.Div(id='flask-cache-memoized-children'),
    dcc.RadioItems(
        id='flask-cache-memoized-dropdown',
        options=[
            {'label': 'Option {}'.format(i), 'value': 'Option {}'.format(i)}
            for i in range(1, 4)
        ],
        value='Option 1'
    ),
    html.Div('Results are cached for {} seconds'.format(timeout))
])


@app.callback(
    Output('flask-cache-memoized-children', 'children'),
    [Input('flask-cache-memoized-dropdown', 'value')])
@cache.memoize(timeout=timeout)  # in seconds
def render(value):
    return 'Selected "{}" at "{}"'.format(
        value, datetime.datetime.now().strftime('%H:%M:%S')
    )


if __name__ == '__main__':
    app.run_server(debug=True)
这里是一个缓存数据集而不是回调的例子。它使用 FileSystem 缓存,将缓存的结果保存到文件系统中。
如果有一个数据集被用来更新几个回调,这种方法很好用。
import datetime as dt
import os
import time

import dash
import dash_core_components as dcc
import dash_html_components as html
import numpy as np
import pandas as pd
from dash.dependencies import Input, Output
from flask_caching import Cache

external_stylesheets = ['https://codepen.io/chriddyp/pen/bWLwgP.css']

app = dash.Dash(__name__, external_stylesheets=external_stylesheets)
cache = Cache(app.server, config={
    'CACHE_TYPE': 'filesystem',
    'CACHE_DIR': 'cache-directory'
})

TIMEOUT = 60

@cache.memoize(timeout=TIMEOUT)
def query_data():
    # This could be an expensive data querying step
    df =  pd.DataFrame(
        np.random.randint(0,100,size=(100, 4)),
        columns=list('ABCD')
    )
    now = dt.datetime.now()
    df['time'] = [now - dt.timedelta(seconds=5*i) for i in range(100)]
    return df.to_json(date_format='iso', orient='split')


def dataframe():
    return pd.read_json(query_data(), orient='split')

app.layout = html.Div([
    html.Div('Data was updated within the last {} seconds'.format(TIMEOUT)),
    dcc.Dropdown(
        id='live-dropdown',
        value='A',
        options=[{'label': i, 'value': i} for i in dataframe().columns]
    ),
    dcc.Graph(id='live-graph')
])


@app.callback(Output('live-graph', 'figure'),
              [Input('live-dropdown', 'value')])
def update_live_graph(value):
    df = dataframe()
    now = dt.datetime.now()
    return {
        'data': [{
            'x': df['time'],
            'y': df[value],
            'line': {
                'width': 1,
                'color': '#0074D9',
                'shape': 'spline'
            }
        }],
        'layout': {
            # display the current position of now
            # this line will be between 0 and 60 seconds
            # away from the last datapoint
            'shapes': [{
                'type': 'line',
                'xref': 'x', 'x0': now, 'x1': now,
                'yref': 'paper', 'y0': 0, 'y1': 1,
                'line': {'color': 'darkgrey', 'width': 1}
            }],
            'annotations': [{
                'showarrow': False,
                'xref': 'x', 'x': now, 'xanchor': 'right',
                'yref': 'paper', 'y': 0.95, 'yanchor': 'top',
                'text': 'Current time ({}:{}:{})'.format(
                    now.hour, now.minute, now.second),
                'bgcolor': 'rgba(255, 255, 255, 0.8)'
            }],
            # aesthetic options
            'margin': {'l': 40, 'b': 40, 'r': 20, 't': 10},
            'xaxis': {'showgrid': False, 'zeroline': False},
            'yaxis': {'showgrid': False, 'zeroline': False}
        }
    }


if __name__ == '__main__':
    app.run_server(debug=True)
版权属于:作者名称
本文链接:https://www.sitstars.com/archives/111/
转载时须注明出处及本声明